


-
 TRON 价格重回均衡,TVL 创下历史新高,能否迎来年度新高?
TRON 价格自 2 月份创下年度高点以来一直在下跌,当时非常接近创下历史新高。尽管有所下降,但 TRON 的总锁定价值 (TVL) 在 3 月份创下了历史新高,与 2021 年其他区块链的情况形成鲜明对比。自 4 月 13 日以来,TRX 价格重新站稳脚跟,突破了主要阻力趋势线。该价格发出了强烈的看涨信号,交易者猜测是否有可能创下年度新高。
-
 稳定币兑换流入严重下降:这对比特币有何不利影响
链上数据显示,稳定币兑换流入最近出现了大幅下降。这可能对比特币价格不利。
-
 以太坊流动质押平台EigenLayer空投引发争议:限制性分配遭质疑
经过数月的期待,以太坊流动质押平台EigenLayer在5月10日星期五开始进行EIGEN的空投。然而,这次分配却引发了一个问题。该代币被地理锁定,不能在未来的未知日期之前转让。这个对EIGEN施加限制的决定引起了对该项目的批评,一些观察家称其为“不法行为”。但也有其他人认为,这是一个聪明的举动,可以保护该公司免受监管压力。
-
 XRP七年的积累即将结束,对价格意味着什么
过去一年,由于涟漪公司与美国证券交易委员会(SEC)之间的法律纠纷所带来的不确定因素,对XRP价格的预期出现了很大波动。然而,即使在2024年这个替代币表现令人失望的情况下,看涨情绪仍然占主导地位,其中一位分析师伪装成一个长期积累趋势即将结束。
-
 2024年迄今为止,美国SEC对六家数字资产企业提起诉讼并向四人发出警告
2024年迄今为止,美国证券交易委员会(SEC)已采取法律行动对抗六家数字资产企业。除此之外,还向另外4人发出警告称他们正在接受调查。这三起诉讼和四份威尔斯通知的指控主要是针对未经注册的证券发行。而针对加密货币公司的其他指控则与证券欺诈有关。
-
 沉寂近11年的比特币钱包突然复苏,赚取了多少利润?
最近,两个沉寂近11年的比特币鲸鱼钱包突然复活,给市场带来了惊喜。匿名的鲸鱼钱包启动了大规模的比特币交易,从他们早期对这个先驱加密货币的投资中获得了可观的利润。
-
 加密货币市场大热,专家预测驼峰将一夜暴富!
在不可预测且动荡的加密货币世界中,经验丰富的专家的预测往往具有重要意义。最近,有一位专家引起了交易员和投资者的注意,他大胆预测山寨币驼峰(Hump)将在未来90天内突破1美元大关。尽管今天的交易价格低于0.02美元,但这位专家的声音足以引发市场的关注。
-
 加密货币分析师预测Shiba Inu将出现3000%的涨幅
加密货币分析师Davie Satoshi为Shiba Inu提出了一个看涨的预测,作为未来主要模因币的前景之一。根据该分析师的说法,在模因币领域涌现了许多加密货币中,SHIB是其中一个潜在出现1000%至3000%价格上涨的模因币。然而, SHIB目前正在与看跌的价格行动作斗争,因为多头势力被空头势力所占优势。
-
 2024第二季度五种最好的山寨币
随着加密货币市场的下跌,交易者正寻找能为他们带来巨大利润的未知代币。本文将重点介绍五种最好的未知山寨币:KangaMoon(简称KANG)、Render(简称RNDR)、Sui(简称SUI)、翁多(Ondo,简称ONDO)和宇宙(Cosmos,简称ATOM)。
-
 比特币长期持有者如同2021年一样积累:BTC准备进行15倍涨幅吗?
比特币目前走势平稳,价格走势平淡,导致交易参与度减弱。但在这种整理行情和更大损失的担忧之中,一位分析师分享了数据,表明长期持有者正在以现货价格进行积累。
-
 近协议,区块链生态中的关键参与者,DTX交易所能否以其创新和变革引领价格变动?
随着加密货币领域的动态性质,投资者正在寻找更好的投资机会,因为它不断开辟具有高投资回报的新投资机会。考虑到专家认为第一层区块链的推出将改变交易所的游戏规则,DTX交易所能否做出更高的价格变动?
-
 Polkadot(DOT)迎来反弹之势?加密货币分析师预测价格将上涨150%
近几周以来,Polkadot(DOT)代币一直面临着显著的下压力。最近比特币价值的下跌进一步加剧了这种负面表现,比特币在过去一周跌破了40,000美元的关口。
-
 富达 FBTC 支持推动比特币 ETF 流入 6600 万美元 富达比特币 ETF FBTC 引领
富达 FBTC 支持推动比特币 ETF 流入 6600 万美元,富达比特币 ETF FBTC 引领美国现货比特币 ETF 流入激增 6600 万美元,表明在持续的市场复苏中,投资者的兴趣重新燃起。
-
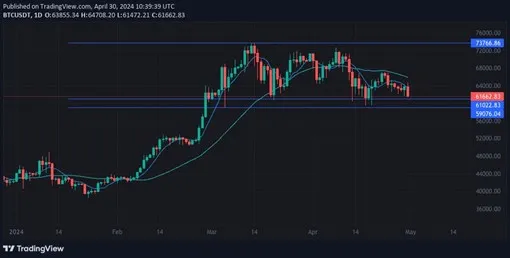
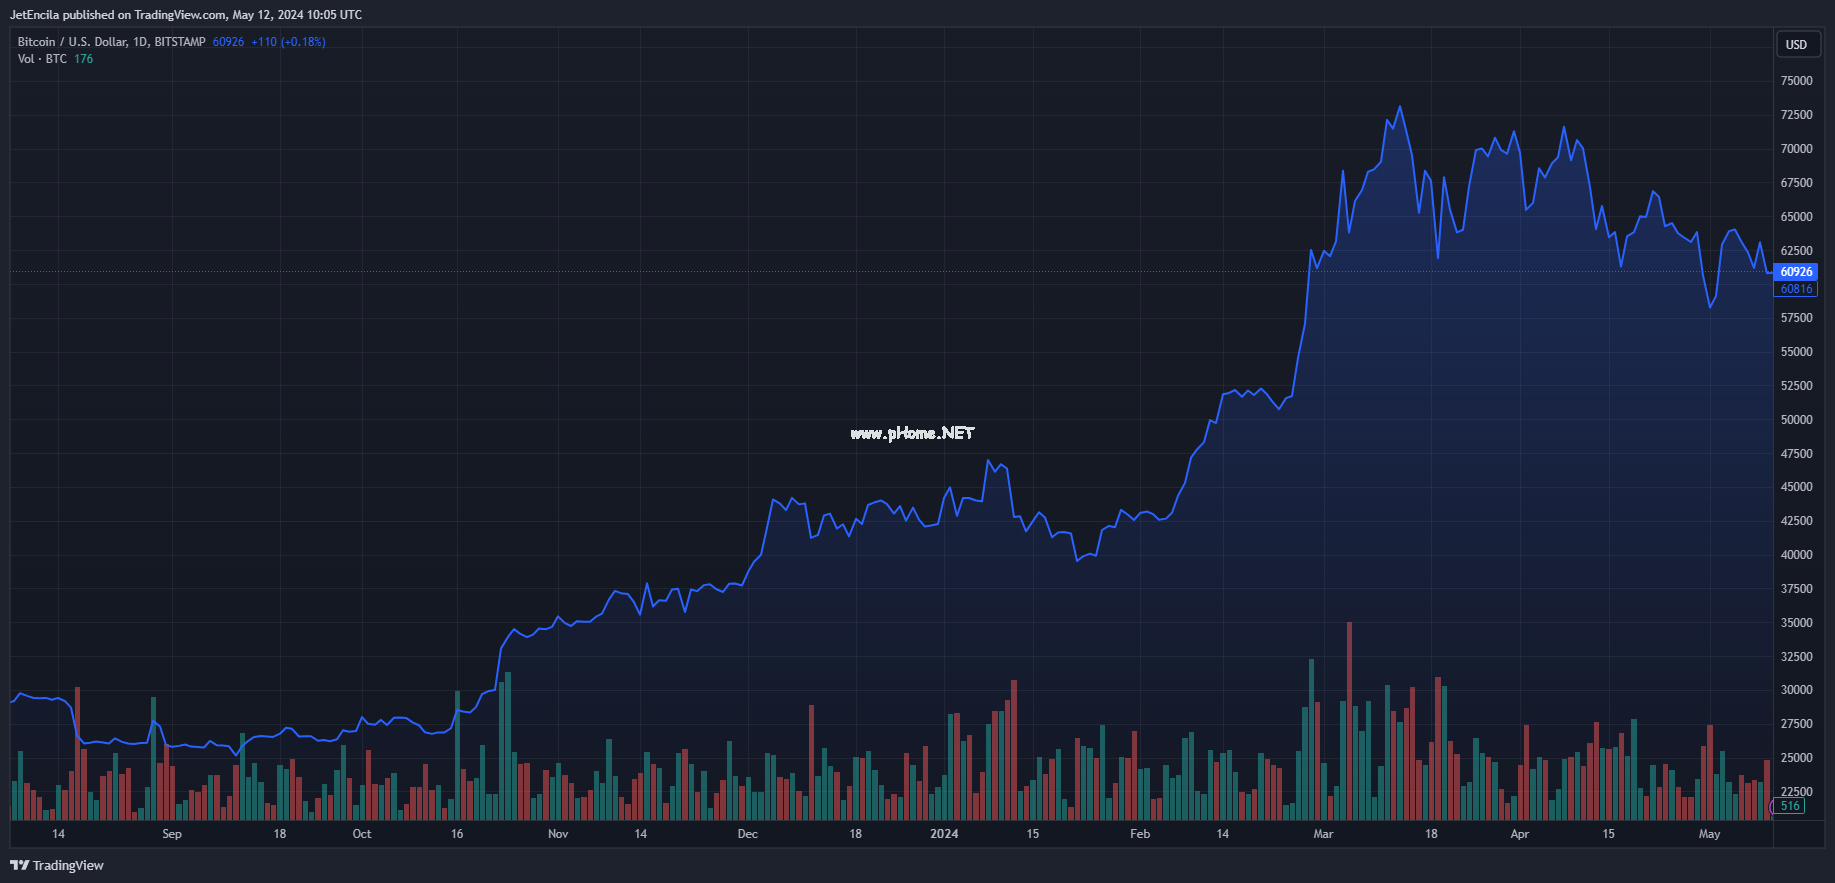
 比特币的六位数未来:分析师看涨
比特币(BTC)在本月开始时出现了本轮行情中最深的回调,下跌至5.6万美元的支撑位。这一回调引起了一些加密货币投资者和市场观察人士的警觉,他们担心牛市已经结束。
-
 NFT的更广泛应用:区块链上的实体世界重新定义
当人们谈论NFT时,通常会想到Bored Ape猴子和数字艺术品。然而, NFT 并不仅仅局限于此,它是一种通用标准,具有更深远的意义。事实上,NFT 在区块链上完美地代表了现实世界的实体物品。举例来说,NFT 可以代表一幅真实的艺术品,使其所有权可以在区块链上进行交易,同时该艺术品仍然存放在受到良好保护的保险箱中。
-
 Solana 价格分析:看涨反转信号可能飙升至 200 美元
Solana 价格分析表明看涨逆转反弹,该加密货币目前交易价格为 144.49 美元。尽管上周出现小幅调整,但 Solana (SOL) 仍表现出韧性,在关键支撑趋势线上方保持强势。
-
 Ripple 将向机构买家保密 XRP 折扣信息
总部位于旧金山的加密支付公司 Ripple 提交了一份综合动议,要求封存与美国证券交易委员会的判决和补救动议有关的某些材料。
-
 SUI价格预测:是时候转向DTX交易所(DTX)了吗?
投资者们不断寻找持有或抛弃一种加密货币的原因。自2023年5月3日主网上线以来,SUI区块链一直是许多加密爱好者的宠儿。与Aptos、Near和Solana等其他区块链可扩展性解决方案相比,其高吞吐量和低延迟显著突出。
-
 MAGA VP $MVP:与未来的美国副总统结盟
作为PolitiFi叙事的新模因标志,MAGA VP代表了每位总统都需要一名副总统在身边的理念。该代币是基于以太坊的模因奖励代币,致力于支持唐纳德·特朗普总统以及他在2024年选举中选择的副总统候选人。
-
 扩大收入:为什么狗狗币(DOGE)持有者应该考虑RCO Finance(RCOF)
作为一个迷因币,狗狗币(DOGE)的价格波动主要受社交媒体炒作、市场情绪和投机交易活动的影响。
-
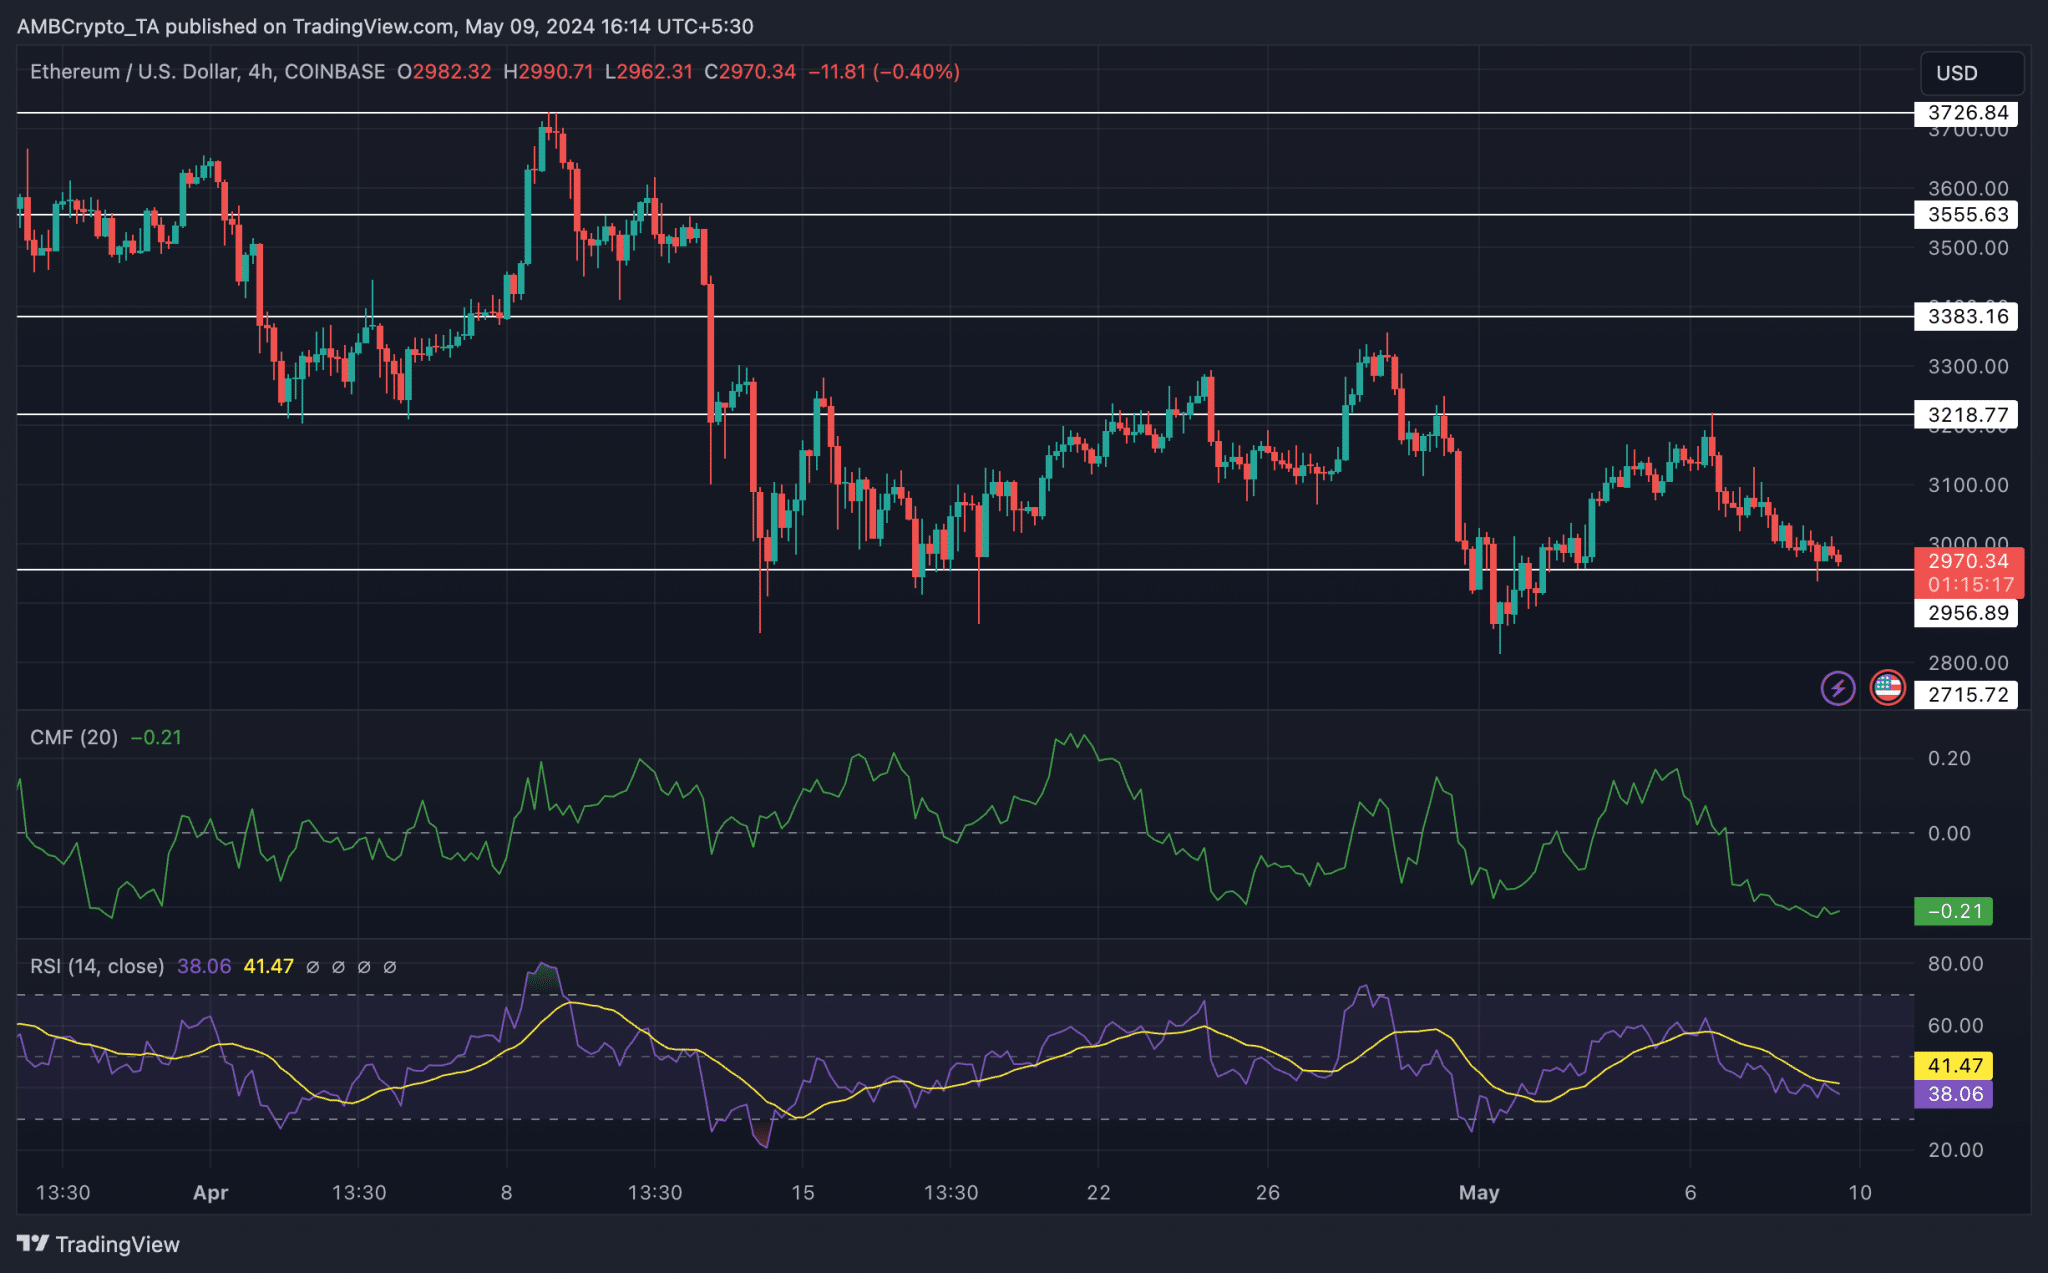
 以太坊网络近期的交易费用出现了显著下降,呼应着比特币最近的链上费用趋势
以太坊网络近期的交易费用出现了显著下降,呼应着比特币最近的链上费用趋势。自2024年3月5日以来的过去68天里,以太坊的网络费用惊人地下降了93.7%,从每笔30.33美元降至仅1.91美元。
-
 Jupiter、Rebel Satoshi和 Sei :引领加密货币世界的创新之路
Jupiter (JUP)近期推出了创新产品Metropolis Part 1,这是一项突破性的更新,大大简化了去中心化交易所内新代币和市场的交易流程。与此同时,Rebel Satoshi ($RBLZ)作为一个专注于去中心化和社区赋权的先进模因币项目正脱颖而出。而Sei (SEI)通过定制不同投资者需求的产品来彻底改变数字资产管理。正是因为这些原因,Jupiter、Rebel Satoshi的$RBLZ和Sei变得日益受欢迎。
-
 DLC 如何实现 Defi 存款并履行比特币的承诺
DLC 最初由闪电网络的共同发明人 Tadge Dryja 于 2018 年提出,它支持新的去中心化金融应用,同时确保比特币存款安全保管。DLC 允许双方根据预定义的条件进行有条件付款。双方确定可能的结果,事先签署,并在知道结果时使用这些预签名执行付款。通过直接在链上提供去中心化安全性,DLC 还确保了比特币网络全部计算能力的基础安全。
-
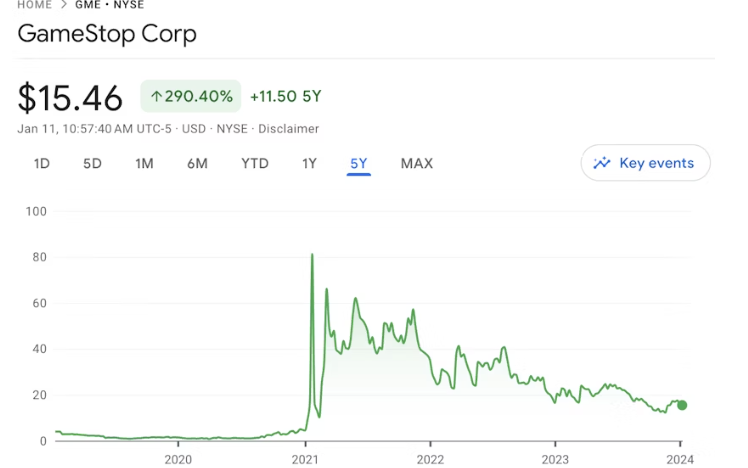
 GameStop股票和Wolverine Memecoins在Roaring Kitty重返公众视野的同时迅速攀升。
2021年,GameStop作为一家视频游戏零售商,在华尔街引发了轰动效应。如今,随着该公司股价飙升百分之百,它再次成为了人们口中的热门话题。
-
 Solana (SOL) 保持交易者首选 DeFi 地位 作为山寨币市场上最热门的 DeFi 代币
作为山寨币市场上最热门的 DeFi 代币之一,Solana (SOL) 在加密货币领域蓬勃发展,赢得了交易者和加密货币爱好者的认可和尊重。凭借卓越的可扩展性解决方案,Solana 一直致力于为托管 DeFi 应用提供安全、透明和无缝的平台。
-
 Dogwifhat(WIF):5月13日暴跌,持续走高或大幅下降?
5月13日,加密货币市场遭遇了暴跌,其中一些币种的受损比其他币种更加严重。在这些币种中,Dogwifhat是最大的输家,其价格在24小时内下跌超过10%。
-
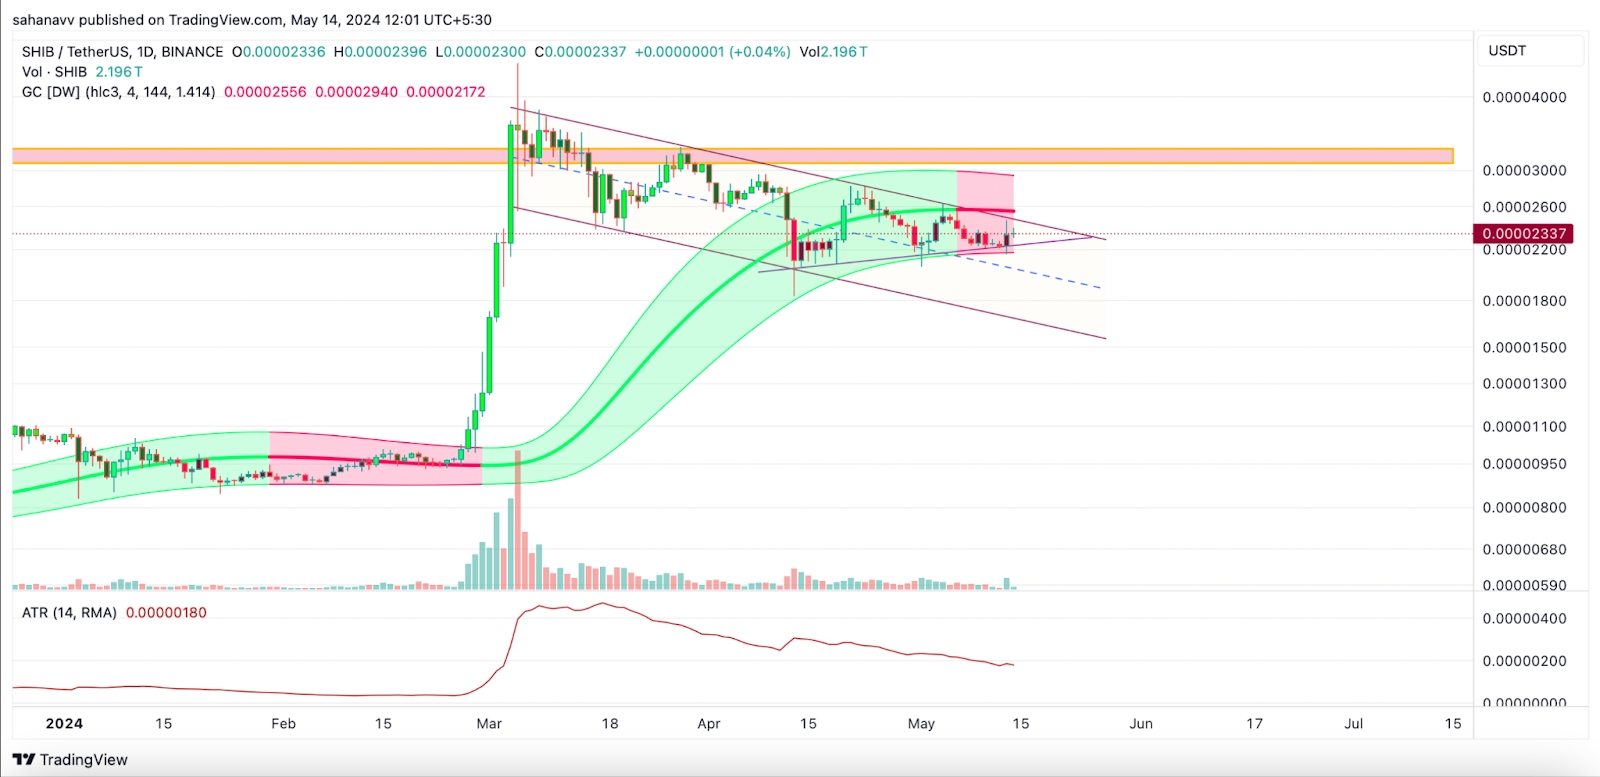 Shiba Inu (SHIB) 价格会突破 0.0003 美元吗?
Shiba INU 似乎被困在一个决定性的对称三角形内的一个区间内,处于下降趋势中。因此,对代币的看跌影响力的大幅增长可能会迫使价格很快突破较低的支撑区域。
-
 比特币预付借记卡在欧洲通过BitStamp可用
知名比特币交易所BitStamp推出了其针对欧洲市场的预付比特币借记卡。这些卡可以在任何接受主要信用卡或借记卡的地方使用。此外,加载到卡上的比特币余额可以转换为美元、英镑或欧元。
-
 模因币是一种受模因启发或具有喜剧特征的加密货币,在数字资产领域引起了广泛关注。狗狗币和柴犬币等著名例
模因币是一种受模因启发或具有喜剧特征的加密货币,在数字资产领域引起了广泛关注。狗狗币和柴犬币等著名例子吸引了全球投资者和爱好者的想象力。这些货币以高波动性而闻名,通常由充足的供应和流行文化现象推动。
-
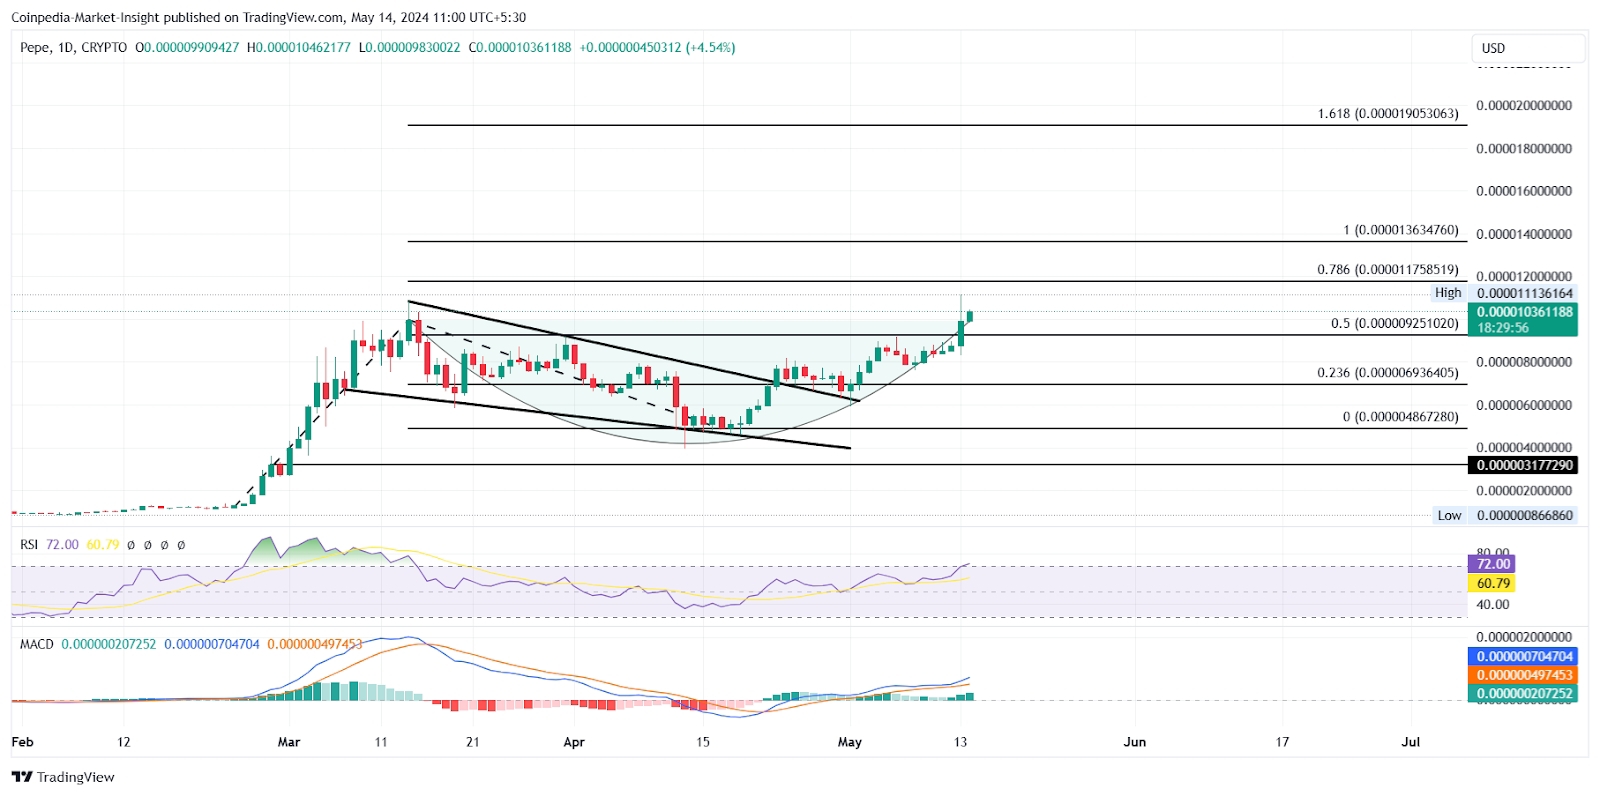 PEPE 价格创历史新高,预示着85% 的上涨潜力
随着加密货币世界中山寨币的牛潮兴起,迷因币产业正在崛起。在看涨势头不断上升的情况下,PEPE代币价格的上涨使其成为24小时内前100名代币中表现最好的。