首先,我们介绍一下如何看行情:
First of all, let's talk about how to look at things:
你可以通过下载行情App来看行情,里面会综合了各个交易所的价格。不过大家的手机内存也有限。我建议既然你用币安,那么直接在币安里面看就可以啦。
You can see it by downloading Love App, which combines the prices of the various exchanges. But everyone's cell phone memory is limited. I suggest that if you use the currency, you can see it directly in the currency.
网页版点左上角的行情:
Page . Click the top left corner:

App版点下方菜单栏的市场这里:
App points the market below the menu bar here:

如上面截图所示,我们进入后便可以看到不同币种的价格和涨跌情况。
As the chart above shows, we can see price increases and falls in different currencies when we enter.
我们以app版本的截图为例。我们选中了第一行的BTC市场,也就是它下面的币种都是以BTC计价的交易对。第一个交易对是
Let's take a screenshot of the app version. We've selected the BTC market in the first line, which is that the currencies below it are all BTC-denominated transactions. The first deal is yes.
我们可以看到第一行BTC市场旁边还有ALTS,这个代表的是山寨币市场,相应的,下面支持ETH,TRX,XRP本位的交易对。还有BNB也同理。
And we can see the first line of the BTC market with ALTS, which represents the cash market, which, accordingly, supports the transaction of ETH, TRX, XRP. The same goes for the BNB.
我们还可以看到中间有个叫FIAT的选项。下面涵盖了很多稳定币的交易对,比如我们最常用的
And we can see that there's an option called FIAT in the middle. The following covers a lot of stable currency transactions, like the ones we use most.
比如你看SXP/BTC交易对,因为BTC自己也有价格涨跌,所以交易对的价格除了受SXP本身的涨跌影响外,还会受到BTC涨跌的影响。但是你看SXP/USDT的话,会更准确。
For example, you see SXP/BTC transactions right, because BTC itself has prices up and down, so the price of the transaction is affected by BTC increases and falls, in addition to SXP itself. But you see SXP/USDT, it's more accurate.
接下来我们先来讲第二部分:K线图的新手指南
Let's start with the second part: the K-liner's New Hand Guide.

什么是K线图?
What's a K-line?
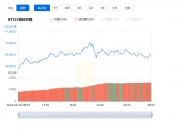
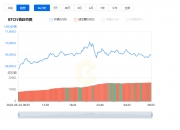
如上图所示,K线图是一种金融图表,以图形方式表示给定时间范围内资产的价格变动。顾名思义,它由柱状体组成,每个柱状体代表相同的时间。柱状体可以代表任何时间范围,从几秒钟到几年。
As shown in the figure above, the K-line chart is a financial chart that graphically represents the change in the price of the asset within the given time frame. By definition, it consists of a column, each of which represents the same time. The column can represent any time frame, from seconds to years.
K线图的工作原理?
How does it work on K-line?
K线图又叫蜡烛图,非常形象地描述了它的形状,就像一个个蜡烛连成的一样。每个蜡烛中间有根灯芯一样的线,叫烛芯或影线。上影线比较长的话,就会比较像一个正放着的蜡烛。
The K-line map is called a candle map, which is a very graphic description of its shape, like a candle chain. Each candle contains a line like the core of a lamp, called a candle core or a film line. If it's longer, it's more like a candle that's in place.
我们选择日线的时候,一个柱状体的时间范围就是一天,月线的话就是一个月,其他的时间段也是同理。
When we choose the solar line, the time frame of one column is one day, the moon is one month, and the rest is the same.

颜色和设置可能会根据不同的市场而有所不同。比如在传统金融市场的话,红色是涨,绿色是跌。但在币圈,就是反过来。通常情况下,如果柱状体为绿色,则表示资产的收盘价高于其开盘的价格。红色则表示价格在时间范围内为下跌,即收盘价低于开盘价。
Colours and settings may vary depending on the market. In traditional financial markets, for example, red is up and green is down. But in currency circles, that is the other way around.
每个蜡烛包括以下价格点,上图柱状图上的数字含义如下:
Each candle consists of the following price points, and the numbers on the graph above mean the following:
1)开盘价—在特定时间范围内资产首个交易价格记录。
1) The opening price - the price of the first transaction of the asset is recorded within a specified time frame.
2)最高价-在特定时间范围内资产的最高交易价格记录。
2) Maximum price - highest transaction price record for an asset within a specified time frame.
3)最低价-在特定时间范围内资产的最低交易价格记录。
3) Minimum price - the lowest transaction price recorded for an asset within a specified time frame.
4)收盘价-在特定时间范围内资产的最后交易价格记录。
(4) Collection of prices - recording of the final transaction price of the assets within a specified time frame.
那么我们要如何读懂K线图?
So how do we read the K-line?
实际上,柱状体显示了一定时期内多头与空头之间的博弈。通常,柱状体越长,在所测量的时间范围内买卖压力就越大,价格波动很大。如果柱状体的长度很短,则意味着测得的时间范围,高点接近收盘价,也就是它波动很小。
In fact, the column shows a game between multiple head and empty head for a certain period of time. Usually, the longer the column is, the greater the pressure on the sales over the measured time frame, and the price fluctuations are high.
总之,K线图是任何交易者或投资者的最基本工具之一。它们不仅可以直观地显示给定资产的价格走势,还可以灵活地分析不同时间范围内的数据。
In short, K-line maps are one of the most basic tools for any dealer or investor. They not only provide a visual view of the price trends of given assets, they also allow for flexible analysis of data over different time frames.
不过,很多人也认为,在对k线进行技术分析的同时,需要结合其他方法,例如基本面分析,也十分重要。基本面分析的话,主要从2个角度,一个是经济周期、行业的角度,一个是你投资的这个标的自身的角度。比如,比特币减半这件事,很多人认为长期回对比特币价格上涨造成的影响。再比如很多人也认同,经济危机的时候法币和传统资产回贬值,然后大家都来购买比特币价格作为一个价值存储,就好比数字黄金一样,大家都来买,然后造成比特币价格的上涨。这些都是从基本面分析。
Many agree, however, that a technical analysis of the kline would need to be accompanied by a combination of other methods, such as a fundamental analysis. The basic analysis would be based mainly on two perspectives, one on the economic cycle, the industry, and the other on the subject of your investment. For example, the halving of bitcoin, many think of the impact of long-term back-to-bitcoin price increases. Many agree, for example, that the French currency and traditional assets devalued during the economic crisis, and then everybody buys bitcoin prices as a value deposit, just like digital gold, and everybody buys them, and then causes bitcoin prices to rise.
接下来是本期的第3部分:技术分析中的常见错误
Next is part 3 of the current period: common errors in technical analysis
1.未设止损
No damage .
“成功交易的要素是:(1)止损,(2)止损,(3)止损。只有遵循了这些原则,你才能有机会盈利。”
“The elements of a successful transaction are: (1) stop the damage, (2) stop the damage, (3) stop the damage. Only by following these principles will you have an opportunity to make a profit.”
在进行交易或投资时,保护资金不受损失则永远都是首要任务。
Protection against loss of funds will always be a top priority when transactions or investments are made.
新手开始交易的最佳理念是:不损失就是胜利。所以最开始的尝试应该是小规模仓位。
The best idea for a newcomer to start a deal is that no loss is a victory. So the first attempt should be a small warehouse.
设置止损是理性的一种表现。就是你忍痛清仓并承认自己交易想法错误。如果你不能保持这种交易心态,则长期效果则不会太理想。有时一笔糟糕交易就有可能对你的投资组合造成巨大不利影响,那时你能做的也只有等待市场回暖。
Set-up damage is a manifestation of rationality. It is you who endures the pain and admits that you are wrong about the idea of trading. If you can’t keep up with this trade mentality, the long-term effect will not be ideal.
2.过度交易
2. Overtrade
在交易者当中,持续不断的交易也是一种常见的错误实践。明智的交易涉及很多技术分析,并需要耐心的等待。在有些交易策略中,你甚至需要等待更长的时间来获得可靠的进场信号。有些交易者每年的交易可能不会超过3笔,但却能获得丰厚的收益。
Among traders, continuing transactions are also common mistakes. Smart transactions involve a lot of technical analysis and require patient waiting. In some transactions, you need to wait longer to get a reliable signal of entry.
保留好资本,以待时机出现更好布置交易。请记住,只要耐心等待,时机总会出现。
Keep the capital until the time comes to make a better deal. Remember that, with patience, the time will always come.
相比于短时间框架的技术分析,长时间范围分析的可靠性更高。短期的技术分析会产生许多市场噪音,而这些迷惑趋势会诱使你进行频繁交易。虽然短期交易可能会为一些投机者带来利润,但它同时也伴有更大的风险。
Short-term technical analysis produces a lot of market noise, and these obsessive trends induce you to engage in frequent transactions. While short-term transactions may generate profits for some speculators, they are also accompanied by greater risks.
3.报复性交易
3. Retaliatory transaction
交易者们在遭受重大损失时都希望能立刻操盘回本。而此种状况下的操作就是我们所说的报复性交易。无论你想成为技术分析师、日内交易者又或是波段交易者,避免情绪化决定是至关重要的。
Dealers want to get what we call a retaliatory transaction when they suffer significant losses. Whether you want to be a technical analyst, a day trader, or a band trader, it is vital to avoid emotional decisions.
当事情展顺利,或者出现微不足道错误时很容易保持冷静。若出现严重危机或错误时又该怎样保持镇定呢?当其他人都惊慌失措时,你是否能坚定不移的执行交易计划呢?
It is easy to remain calm when things go well, or when there are minor mistakes. How can you remain calm when there is a serious crisis or mistake? Can you stay steadfast in carrying out the deal when everyone else panics?
“技术分析”强调的是对市场趋势的预测性分析。如果你想成功,就应该在突发情况中保持冷静。避免情绪化决定,保持逻辑思维并进行合理技术分析才是致胜之道。
“Technology analysis” emphasizes predictive analysis of market trends. If you want to succeed, you should remain calm in a sudden event.
很多人在经历重大损失之后,会立即交易想回本,往往会造成更坏的结果,所以明智的交易者会在一段时间内停止交易。这样他们才能冷静的思考并随后进行理智的交易策略。
A lot of people go through a lot of bad losses, often with worse results, and wise traders stop trading for a while. So that they can think calmly and then engage in rational trading strategies.
4.固执己见
4. Perseverance
如果你想成为一名成功的交易者,就需要学会应变,不要顽固不化。我们都知道,币圈一天,人间一年。而作为交易者的你就需要识别并适应这些变化。在某些市场环境中有效的策略在其他状况下可能完全没用。
If you want to be a successful dealer, you need to learn to adapt and not be obstinate. We all know that the currency circle is one day, one year in the world. And you need to recognize and adapt to these changes.
很多人都有偏见。偏见会严重影响你的决策和判断,并限制了思路。所以请确保不要被自己的偏见所影响。
Many people are prejudiced. Prejudice has a serious impact on your decision-making and judgment and limits your thinking. So please make sure not to be influenced by your own bias.
5.忽略极端市场环境
5. Ignore extreme market environments
有些极端情况下,例如今年出现的312事件,比特币一下子跌倒三千多。大众心理和情绪变化,导致市场的需求和供应不平衡,出现极端市场状况,技术分析的预测效果就变得不太可靠。
In extreme cases, such as this year’s 312 events, Bitcoin fell by more than 3,000. Changes in popular psychology and emotions, leading to imbalances in demand and supply in markets and extreme market conditions, make the predictions of technical analysis less reliable.
基于技术工具的极端指数做决定,可能会造成很大损失。尤其是在价格趋势很难预测的“黑天鹅事件”期间。此类事件没有任何分析工具可以有效预测。这就是为何使用技术分析工具时不能依赖单一指标。
Decisions based on extreme indices of technological tools can be costly. Especially during the “black swan event” when price trends are difficult to predict. There is no analytical tool for predicting such events. That is why a single indicator cannot be relied on when using a technical analysis tool.
6.忘记TA只是概率性预测
6. Forget that TA is just a probabilistic forecast.
技术分析并不是绝对指标,它只表示事件的可能性。这就意味着无论使用何种技术手段来制定策略,都无法保证结果朝着预期方向发展。你的分析指标可能暗示市场极有可能会上涨或下跌,但也只是可能并不绝对。
Technical analysis is not an absolute indicator; it only indicates the likelihood of an event. This means that whatever technical means are used to design a strategy, there is no guarantee that the outcome will move in the desired direction.
永远都不要认定市场趋势一定会按照你的分析方向发展。如果你真的这样认为,并进行了大额投注,则资金损失的风险也会更大。
Never think that market trends are going to follow your analysis. If you really think that, and you make a big bet, there is a greater risk of financial loss.
总结
Summary
总结一下,制定交易策略并不容易,而以长期心态设定交易会更可行!
To sum up, it is not easy to develop a trade strategy, but it is more feasible to set a deal with a long-term mentality!
想熟练的掌握各种交易技巧则需要长期的实践。你需要通过大量的时间来确定并制定适合自己的交易策略。这样你才能逐渐发现自己的优势并确定劣势,最后才能有效控制自己的交易和投资决策。
You need a lot of time to determine and develop your own business strategy. So that you can gradually discover your strengths and determine your weaknesses and, finally, effectively control your own transactions and investment decisions.
今天的教程分享好啦~欢迎收藏和转发给有需要的朋友
Today's lesson is shared. Welcome to the collection and to friends in need.
标签:比特币比特币价格YOUITC比特币现在一枚多少钱比特币价格实时行情币价格YouCoin Metaversebitcoin交易所正规吗
Label: "https://www.obwq.com/tag/bitcoin.html""bitcoin price"https://www.obwq.com/tag/bitcoin"
注册有任何问题请添加 微信:MVIP619 拉你进入群

打开微信扫一扫
添加客服
进入交流群



发表评论