

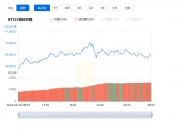
比特币当前的交易价为9600美元,较上周六的8900美元低点上涨了不到10%。Altcoins(山寨币)基本上跟随BTC走高,涨幅相似。
Bitcoin's current transaction price is $9,600, which is less than 10% higher than the $8,900 low last Saturday. Altcoins basically follows the BTC, with a similar increase.
虽然上周六自低点的反弹令许多分析师看涨,但有证据表明,比特币在未来几个小时,或者几天内将需要稍作喘息。
While the rebound from a low point last Saturday has raised many analysts, there is evidence that Bitcoin will need a little breathing in the next few hours or days.
为什么比特币可能会出现小幅回调
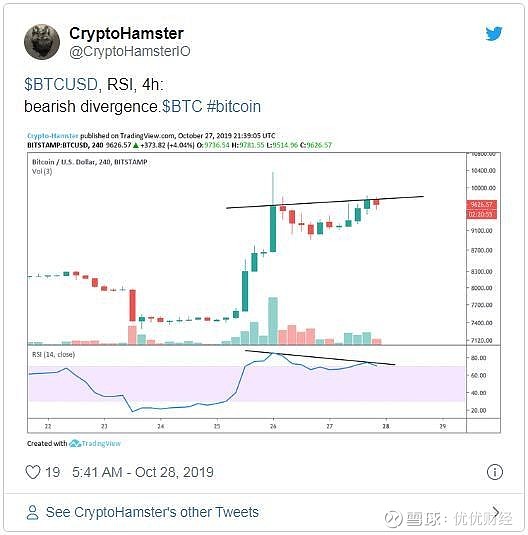
首先也是最重要的是,据称比特币的图表上出现了短期看跌背离[1]。根据分析师CryptoHamster的说法,随着BTC的价格上涨和相对强度指数(RSI)下降,形成了看跌背离,这意味着短期内该加密货币可能会再次跌破9000美元。
First and foremost, Bitcoin’s chart is said to have seen a short-term deviation. According to analyst CryptoHamster, as the BTC price increase and the relative strength index (RSI) have fallen, there is a drop-off deviation, which means that the encrypted currency may fall again by $9,000 in the short term.
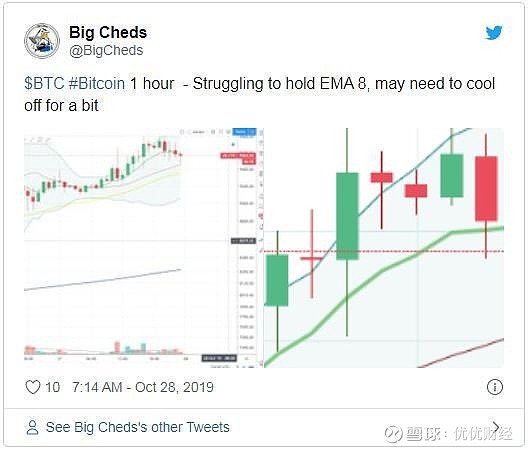
这还不是全部。交易员BigCheds指出,比特币一直在努力维持该资产一小时图的8指数移动平均线,并显示出逆转至9400美元的迹象,并且已经看到许多看跌背离开始解决。
This is not all. Trader BigCheds says that Bitcoin has been trying to maintain the average eight-indicator moving line of the one-hour map of the asset, showing signs of a reversal to $9,400, and has already seen many drop-off deviations begin to be resolved.
此外,芝加哥商品交易所(CME)的BTC期货在周五收盘价8700美元和每周开盘价9700美元之间出现1000美元的巨大缺口。
In addition, the BTC futures of 这可能并不意味着任何事情。但是,比特币有填补缺口的历史,在CME市场不交易的情况下,价格一直上下波动。Richard Heart的图表表明,在出现缺口后的几周内,BTC几乎填补了每个CME的每日缺口。 This may not mean anything. But Bitcoin has a history of filling the gap, and prices have fluctuated up and down in the absence of a trade-off in the CME market. Richard Heart’s chart shows that in the weeks following the gap, BTC almost filled the daily gap for each CME. 不管短期情况如何,比特币的长期前景开始再次看好多头。 Whatever the short-term scenario, Bitcoin's long-term prospects are beginning to look back. JB的一位分析师指出,随着比特币从7700美元升至9700美元的最新走势,比特币的三日走势图看起来非常看涨。 According to an analyst in JB, the three-day trend in Bitcoin appeared to be very high with the latest movement of Bitcoin from $7,700 to $9,700. 他提请注意以下原因来支持他的预测:最近的蜡烛可以定义为“看涨吞没蜡烛”,其下降趋势线始于6月的14000美元高位,市场已经达到数月来最大的交易日, MACD[2]正在显示看涨背离,而Willy指标现在离开超卖区域。 He drew attention to the following reasons to support his prediction: the most recent candles could be defined as “watching swallowing candles”, the downward trend line had begun at a high of $14,000 in June, the market had reached its largest trading day in months, the MACD [2] was showing upwards and deviations, and Willy’s target was now leaving the oversold area. [1].背离:当指标和价格所显示的信息不相符时,就发生背离,意味着指标不支持价格。看涨背离指,价格创新低而指标创新高;看跌背离指,价格创新高而指标出现新低。[2].MACD(Moving Average Convergence / Divergence)称为异同移动平均线,MACD的意义和双移动平均线基本相同,即由快、慢均线的离散、聚合表征当前的多空状态和股价可能的发展变化趋势。 [1]. Deviation: A deviation occurs when the information shown by indicators and prices does not match, meaning that the indicator does not support the price. A rise-off means a low price innovation and a high indicator innovation; a drop-off means a high price innovation and a new indicator low. [2]. MACDs (Moving Power Conversation/Diversity) are referred to as a different and moving mean line, and the meaning of the MACD is essentially the same as the two-way average, i.e., the current trend of fragmentation by fast, slow-balanced lines, the current multi-emptiness of aggregates and possible changes in stock prices.[2]. 声明:本文由优优财经编译,仅代表作者个人观点,不构成投资建议,转载请注明来源。 Declaration: This document, which has been translated into good financial standing and represents the author's personal opinion only, does not constitute an investment proposal and is reproduced with reference to the source. 原文:文章来源 Original language: Source of article 文章来源:优优财经:文章来源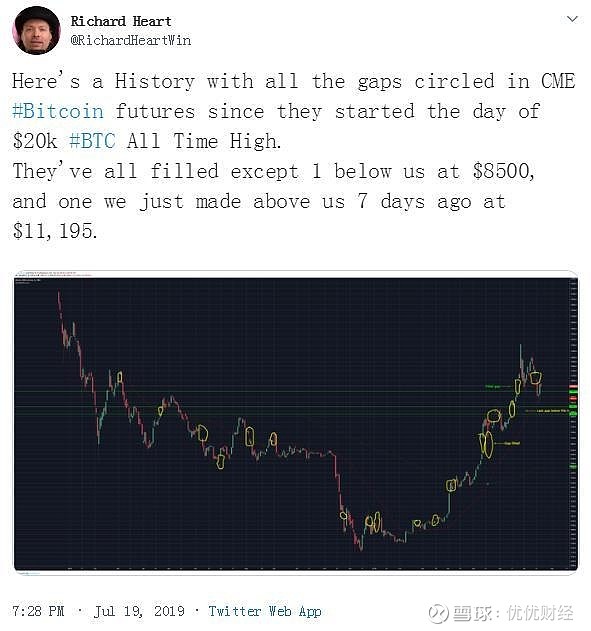
长期趋势形成积极局势
优优财经注:
注册有任何问题请添加 微信:MVIP619 拉你进入群

打开微信扫一扫
添加客服
进入交流群



发表评论